Hey folks,
Recently, I was trying to level up the observability of my home automation system, and I was inspired by what has been done by Carmelo and Patrick, who had similar experiences for their own needs.
TL;DR
Going Further :mag_right:
Previously, the only graph that I had was the built-in graph from my home automation system, Jeedom, and it was pretty bad (see below).
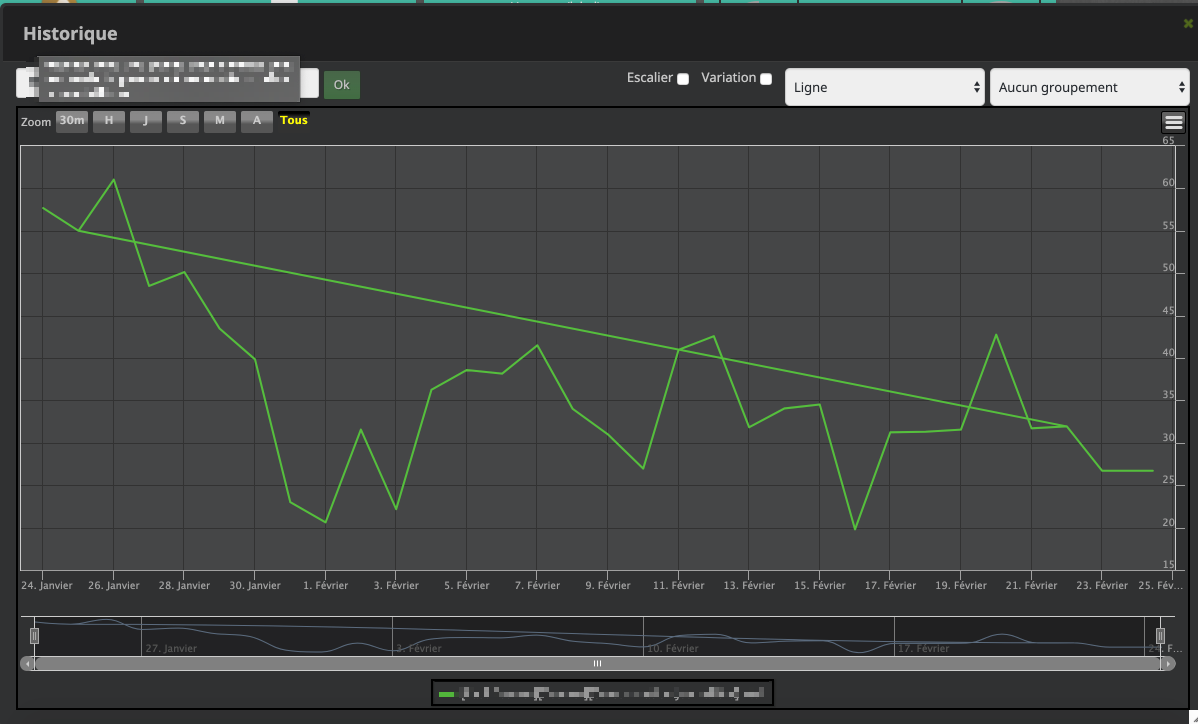
- Poor UI/UX
- No Dashboarding capabilities
- Single graph type
- No stacked view
About Jeedom
Jeedom is a French open-source home automation system, based on PHP, multi-protocol, autonomous and highly customizable. It’s the direct European alternative to the well-known Home Assistant. They have a great community here in France.
I’ve been running Jeedom for 2 years on a Raspberry Pi with an external SSD, since my previous installation on SD Card suddenly crashed due to the death of the SD card.
The goal
My objective is to offer a better graph experience for my local usage, in an isolated and portable environment, hosted locally on my Raspberry Pi. It could also be useful for the community thanks to easier deployment.
Components
- Jeedom as the centralized Home Automation System with a myriad of IoT sensors/captors.
- DD-WRT as the Home Router: WLAN and LAN connectivity.
- Bonus: Twitter metrics for my accounts (Following/Followers).
I was asking myself if it makes sense to use AWS or another Cloud Service Provider (CSP) to deploy my new graph stack. But the need to keep costs as low as possible and to keep everything local ruled out this hypothesis.
Maybe later I will need to access it from a remote location; then I will ship it to AWS, and thanks to Docker, it will be neat ;-)
You will tell me, another option is to NAT the corresponding port on my ISP box. True. :dizzy_face:
To reach my objective, I will automate a full deployment of a home observability stack using:
Using multiple Docker containers (with docker-compose) on my Raspberry Pi (Raspbian).
The Stack
Jeedom Bridge
I’m using this tool to create a bridge between Jeedom metrics and InfluxDB. It’s a small Python server that listens on a specific TCP port on your Raspberry Pi, and then forwards events to InfluxDB.
InfluxDB
InfluxDB handles the persistence layer of all metrics in a time series DB.
From Wikipedia: InfluxDB is an open-source time series database developed by InfluxData. It is written in Go and optimized for fast, high-availability storage and retrieval of time series data in fields such as operations monitoring, application metrics, Internet of Things sensor data, and real-time analytics.
I’m using Docker volumes to persist data. We will see later how to back up Docker volumes.
- Docker Volumes - How to back up volumes?
Telegraf
Telegraf is a very popular server agent for collecting and sending metrics and events. Written in Go, with a very limited memory footprint.
I’m using Telegraf with SNMP plugins to crawl my DD-WRT Router.
Grafana
Grafana is also a well-known analytics and data visualization platform, one of the most used solutions among “DevOps” folks.
One cool thing is that your final dashboard is nothing more than a JSON file that can be easily backed up or shared with others.
The Result
You will find below the result of my Home Automation Dashboard.
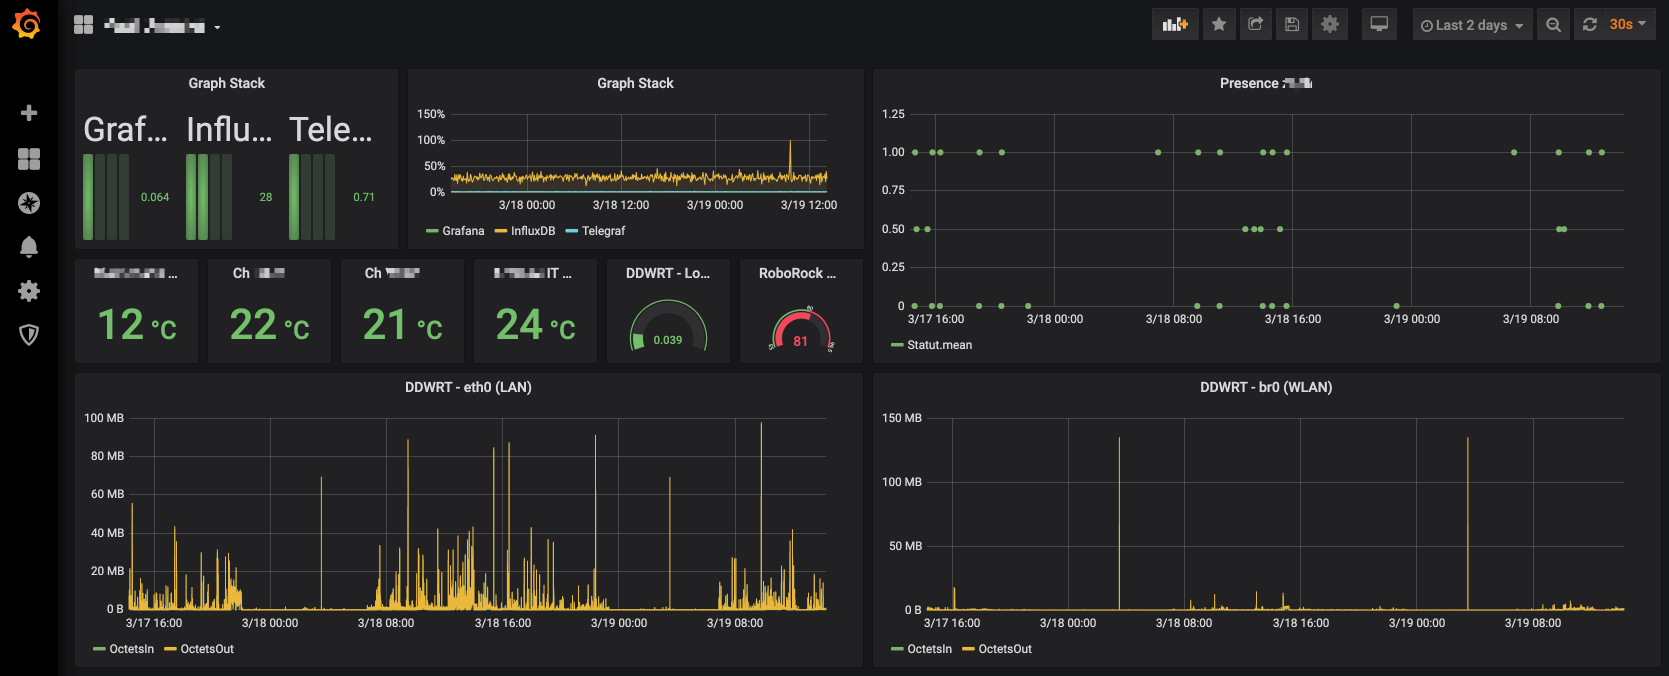
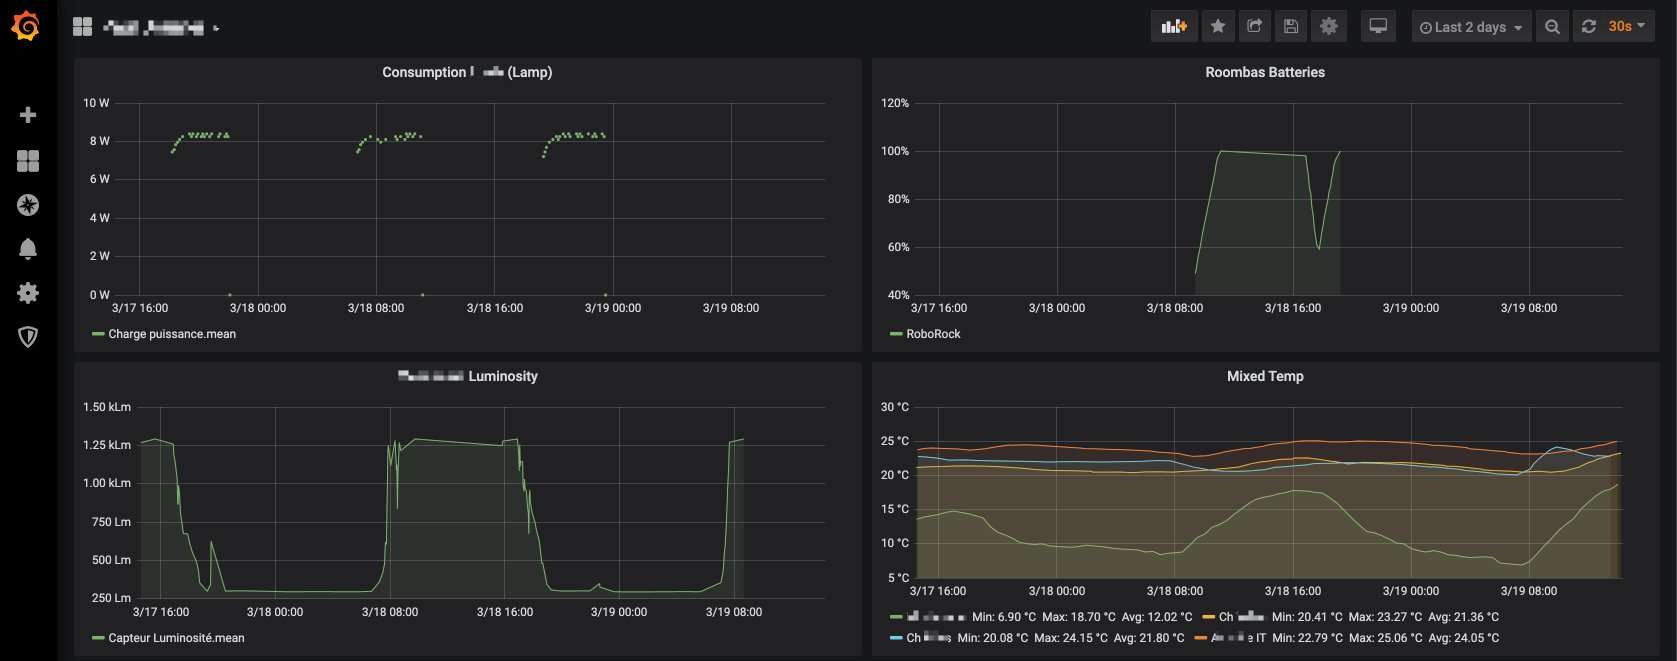
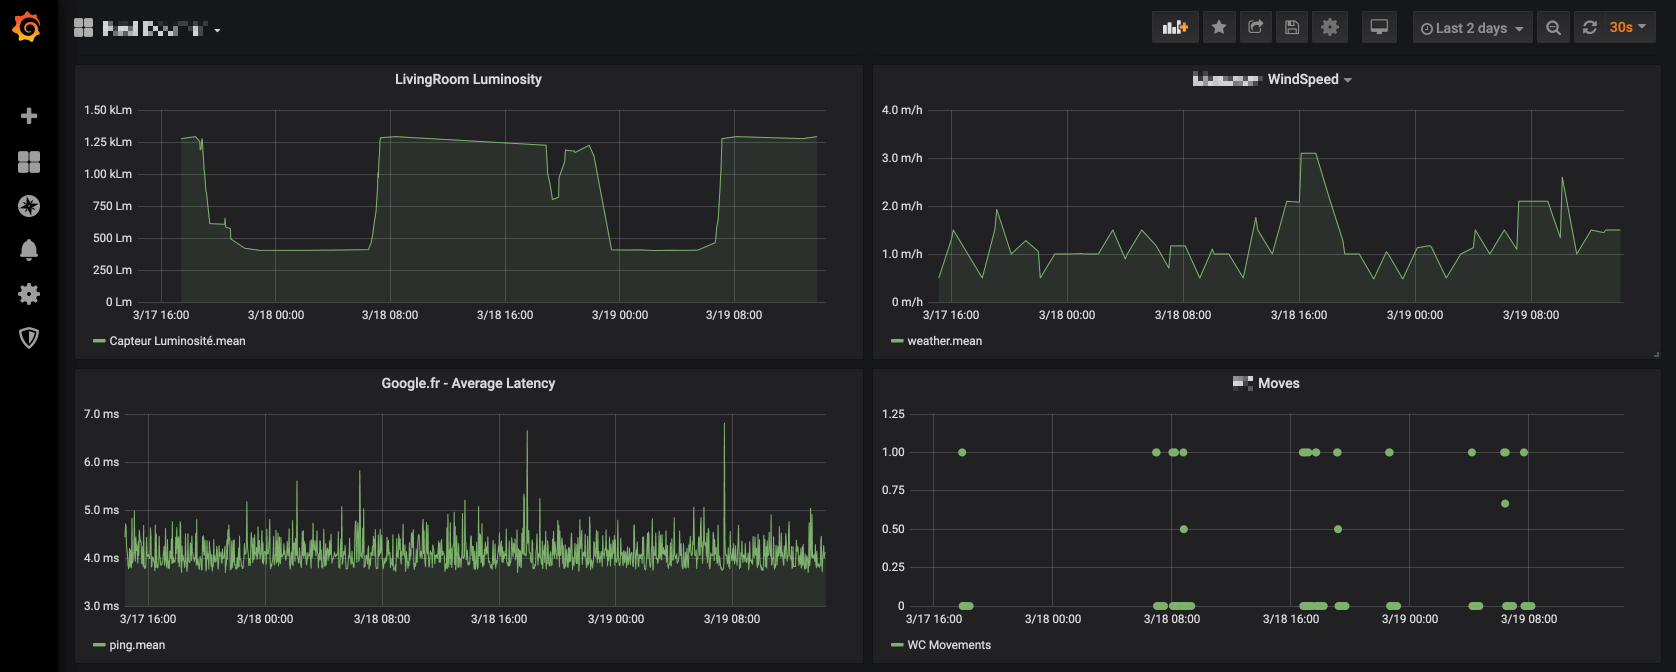
My stack is available on GitLab: here.
Please don’t hesitate to contribute, submit a MR, or open Issues.
References (used documentation)
- https://www.carmelo.fr/jeedom-grafana-marier-la-domotique-et-la-metrologie/
- https://blog.laputa.io/try-influxdb-and-grafana-by-docker-6b4d50c6a446
- https://github.com/jkehres/docker-compose-influxdb-grafana
- https://github.com/mlabouardy/telegraf-influxdb-grafana/blob/master/conf/telegraf/telegraf.conf
- https://www.jacobtomlinson.co.uk/monitoring/2016/06/23/running-telegraf-inside-a-container/
- https://devconnected.com/how-to-install-influxdb-telegraf-and-grafana-on-docker/
- https://github.com/jkehres/docker-compose-influxdb-grafana/blob/master/grafana-provisioning/datasources/datasource.yml
That’s all folks!
zoph.