TL;DR
HighCharts -> APIGW -> DynamoDB + Lambda function 🎉 cockpit.zoph.io
Introduction
Lately, I was working on a new version, API based, for my Twitter Cockpit. In the previous version, Highcharts was loading data from some flat csv files.
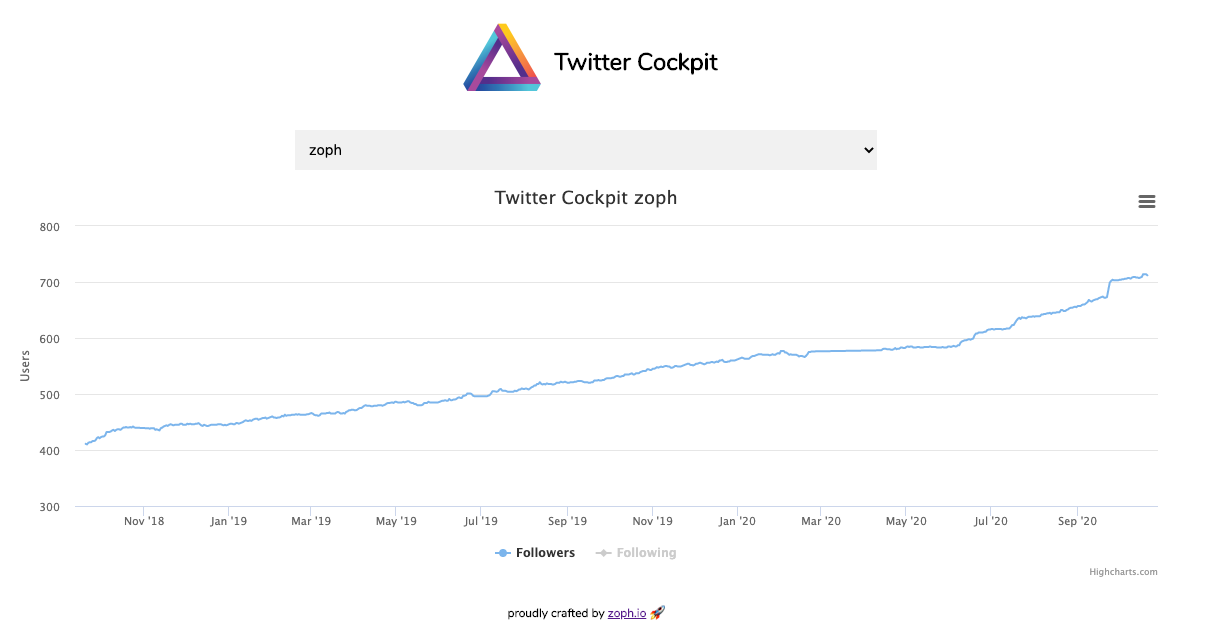
The goal of this cockpit is to retrieve and store unlimited history for specific Twitter accounts based on a Twitter list. It means that you can control from Twitter which accounts you want to graph for follower/following history. When you are using Twitter Analytics, the history only compares followers (not following) to the previous 28-day period, and the graph is in fact a non-clickable thumbnail image, a very poor experience for free users.

For me, it was an opportunity to work on DynamoDB data modeling, and craft an API Gateway from scratch. 🧑🏭
Technical Stack
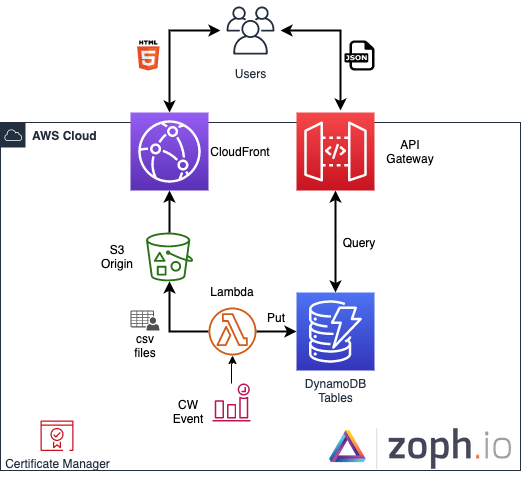
- CloudFront + S3 Origin + ACM Certificate
- API Gateway
- DynamoDB Tables
- IAM Roles
- GitHub Actions as CI/CD Pipeline
Architecture Schema
DynamoDB Tables
You will need to carefully prepare your data model here, and understand clearly how DynamoDB is working under the hood.
For my use case, I’ve decided to use two DynamoDB tables, one for user statistics, and another one for the user list, used later for the <select> on the webapp.
Stats table
The data model for this table is pretty simple, I’m using the following attributes:
scan_dateas the hash keyscreen_nameas the range (sort) key
As my scan_date is not unique, I needed to select a range key as well.
Beware of the reserved words on DynamoDB.
Now, I need to query the table by user, because my graph is on a per-user basis. To do so, I’ve used a Global Secondary Index (GSI):
screen_nameas the hash keyscan_dateas the sort key, as my data needs to be ordered by date for HighCharts
The advantage of the index is that you only need to specify one attribute when you are querying this index, in my case screen_name.
Users table
The goal of this table is to store, and later expose, the list of users currently crawled by the lambda (from the Twitter list).
The data model for this table is pretty straightforward: screen_name only, as this attribute will be unique. That’s all.
At this stage, for the users table, I’m using a Scan on DynamoDB to retrieve the full list of users.
API Gateway
To get data from DynamoDB, we will need to create a GET API method, and apply some transformation using Apache’s Velocity Templating Language (VTL). Beware: the AWS service method to interact with DynamoDB is a POST method.
Integrated Request - Mapping Template
In this mapping, we are passing the input parameter to the KeyConditionExpression, and we query the index (GSI).
Integrated Response
For each item, I need to format the response from the API Gateway from the DynamoDB format, using Integrated Response, into the expected result that fits the requirements of Highcharts.
#set($inputRoot = $input.path('$'))
{
    "cockpit": [
        #foreach($elem in $inputRoot.Items) {
            "scan_date": "$elem.scan_date.S",
            "screen_name": "$elem.screen_name.S",
            "followers": "$elem.followers.N",
            "following": "$elem.following.N"
        }#if($foreach.hasNext),#end
	#end
    ]
}
Frontend
This was the hardest part for me, as I’m more of a backend / infrastructure guy…
I’m only using some HTML and JavaScript (jQuery) + CSS.
Conclusion
The integration between API Gateway and DynamoDB is pretty cool and easy to manipulate; you don’t need to use a proxy Lambda function for every use case. This architecture is scalable, managed, and cost-efficient.
The source code for this workload is not yet open-sourced, as some elements are not yet fully automated. Please tell me if you are interested in getting early access.
That’s all folks! Don’t hesitate to Ask Me Anything (AMA) in the comments or on Twitter.
zoph.